

imagetovideo
Transform Images & Text into Stunning AI Videos
PaperBanana: Automating Academic Illustration with AI.Transform raw scientific content into publication-quality diagrams and plots automatically.
Transform raw scientific content into publication-quality diagrams and plots automatically. PaperBanana lifts the illustration bottleneck in your research workflow.、Try
No design skills required. No complex prompts. Just provide your scientific content and let PaperBanana orchestrate specialized agents to generate publication-quality diagrams and plots.
PaperBanana AI Illustration Generator
Input your research content—methodology, data, or concepts—and watch PaperBanana transform it into professional academic illustrations.
Enter a prompt on the left and click ‘Generate Images’ to create your illustration.
Despite rapid advances in autonomous AI scientists, generating publication-ready illustrations remains a labor-intensive bottleneck. PaperBanana is an agentic framework that orchestrates specialized agents—Retriever, Planner, Stylist, Visualizer, and Critic—to transform raw scientific content into publication-quality diagrams and plots.
Reference-Driven Generation
PaperBanana retrieves relevant reference examples to guide style and content, ensuring your diagrams match academic standards.
Multi-Agent Collaboration
Five specialized agents work together: Retriever, Planner, Stylist, Visualizer, and Critic—each handling a critical step in the illustration pipeline.
Iterative Self-Critique
The Critic agent inspects generated images against source content, providing feedback for automatic refinement until publication-ready.
PaperBanana Gallery
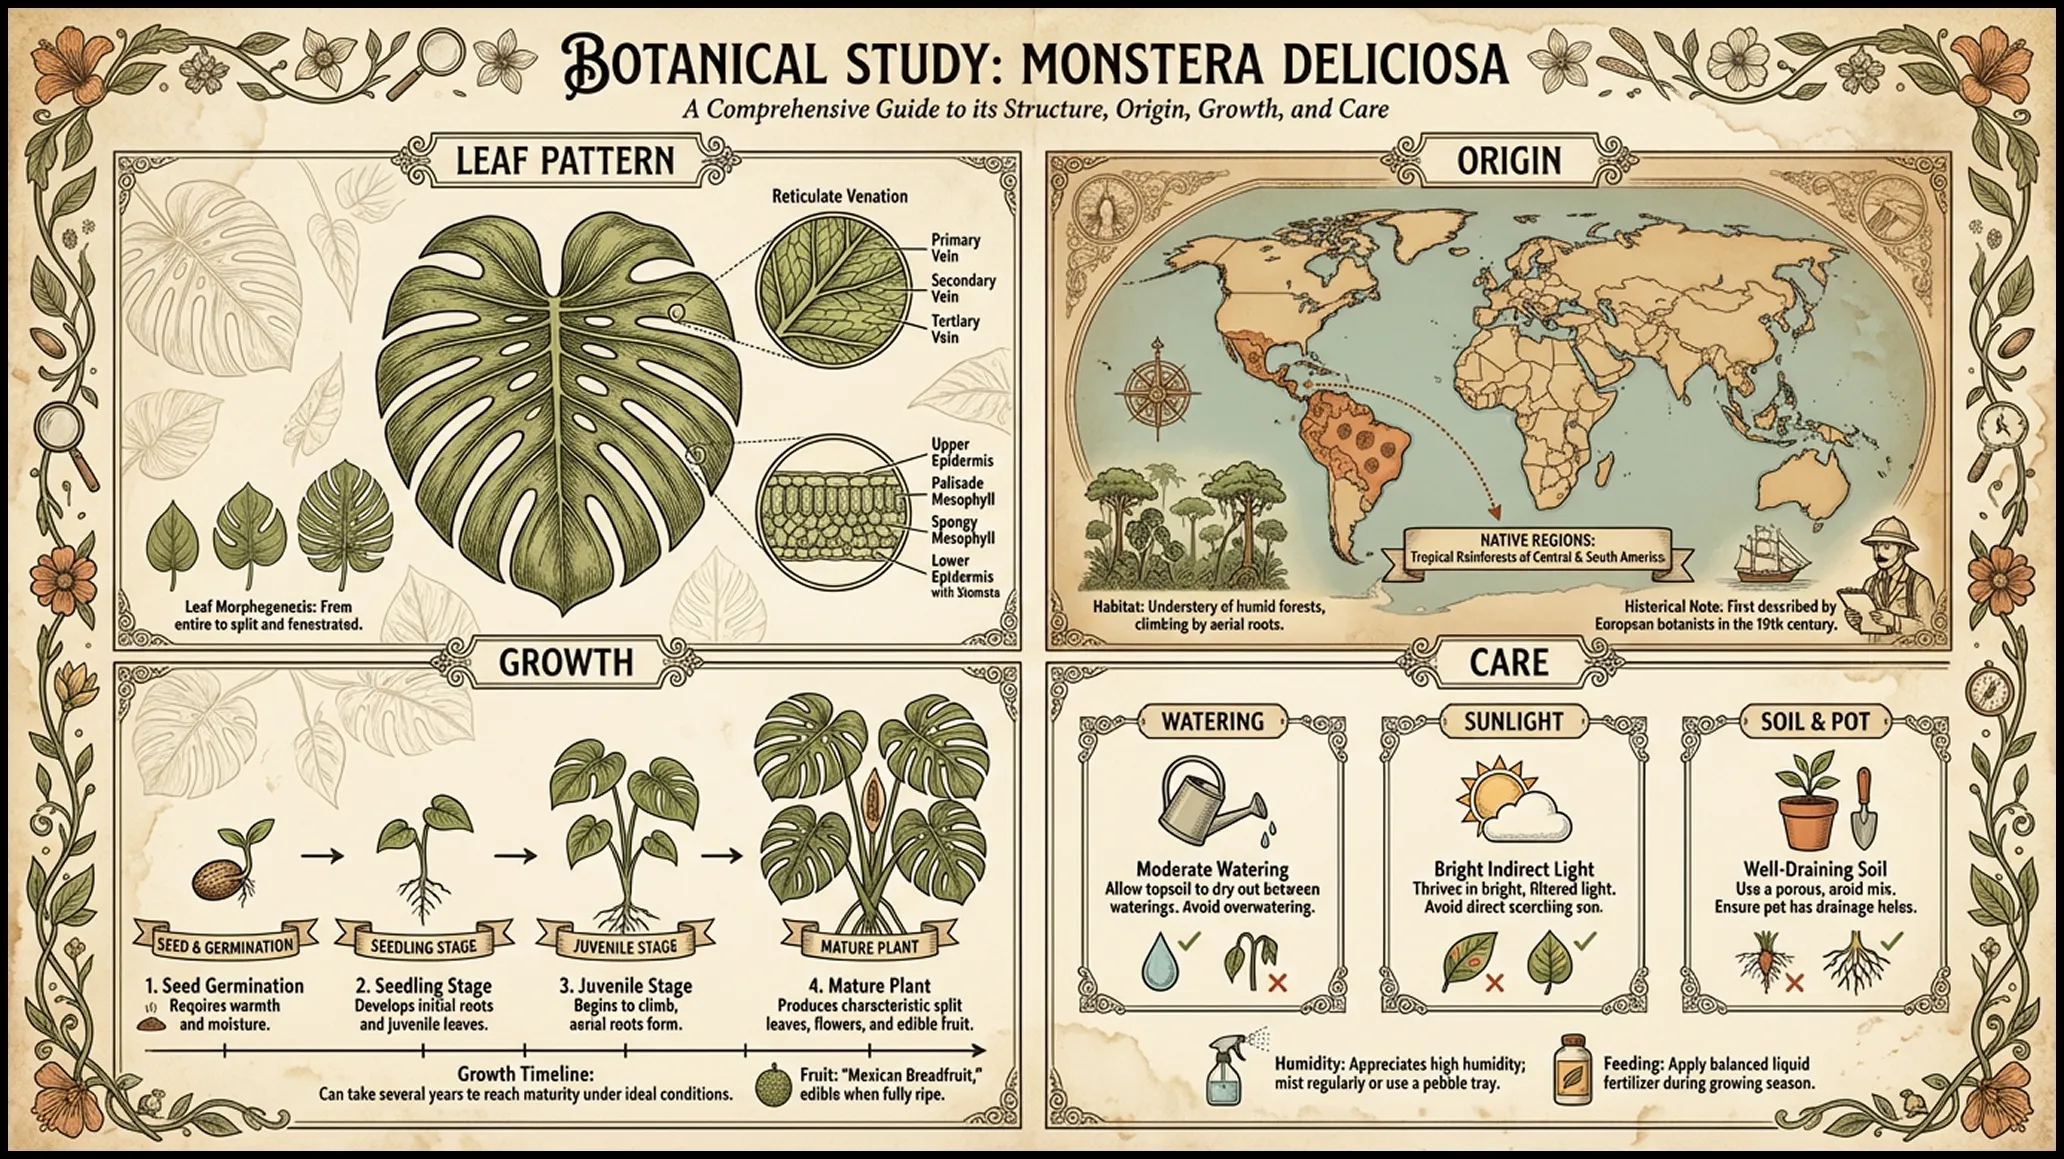
From methodology diagrams to statistical plots, PaperBanana handles it all. Every example below was generated directly from text descriptions by PaperBanana’s multi-agent workflow—no manual editing required.
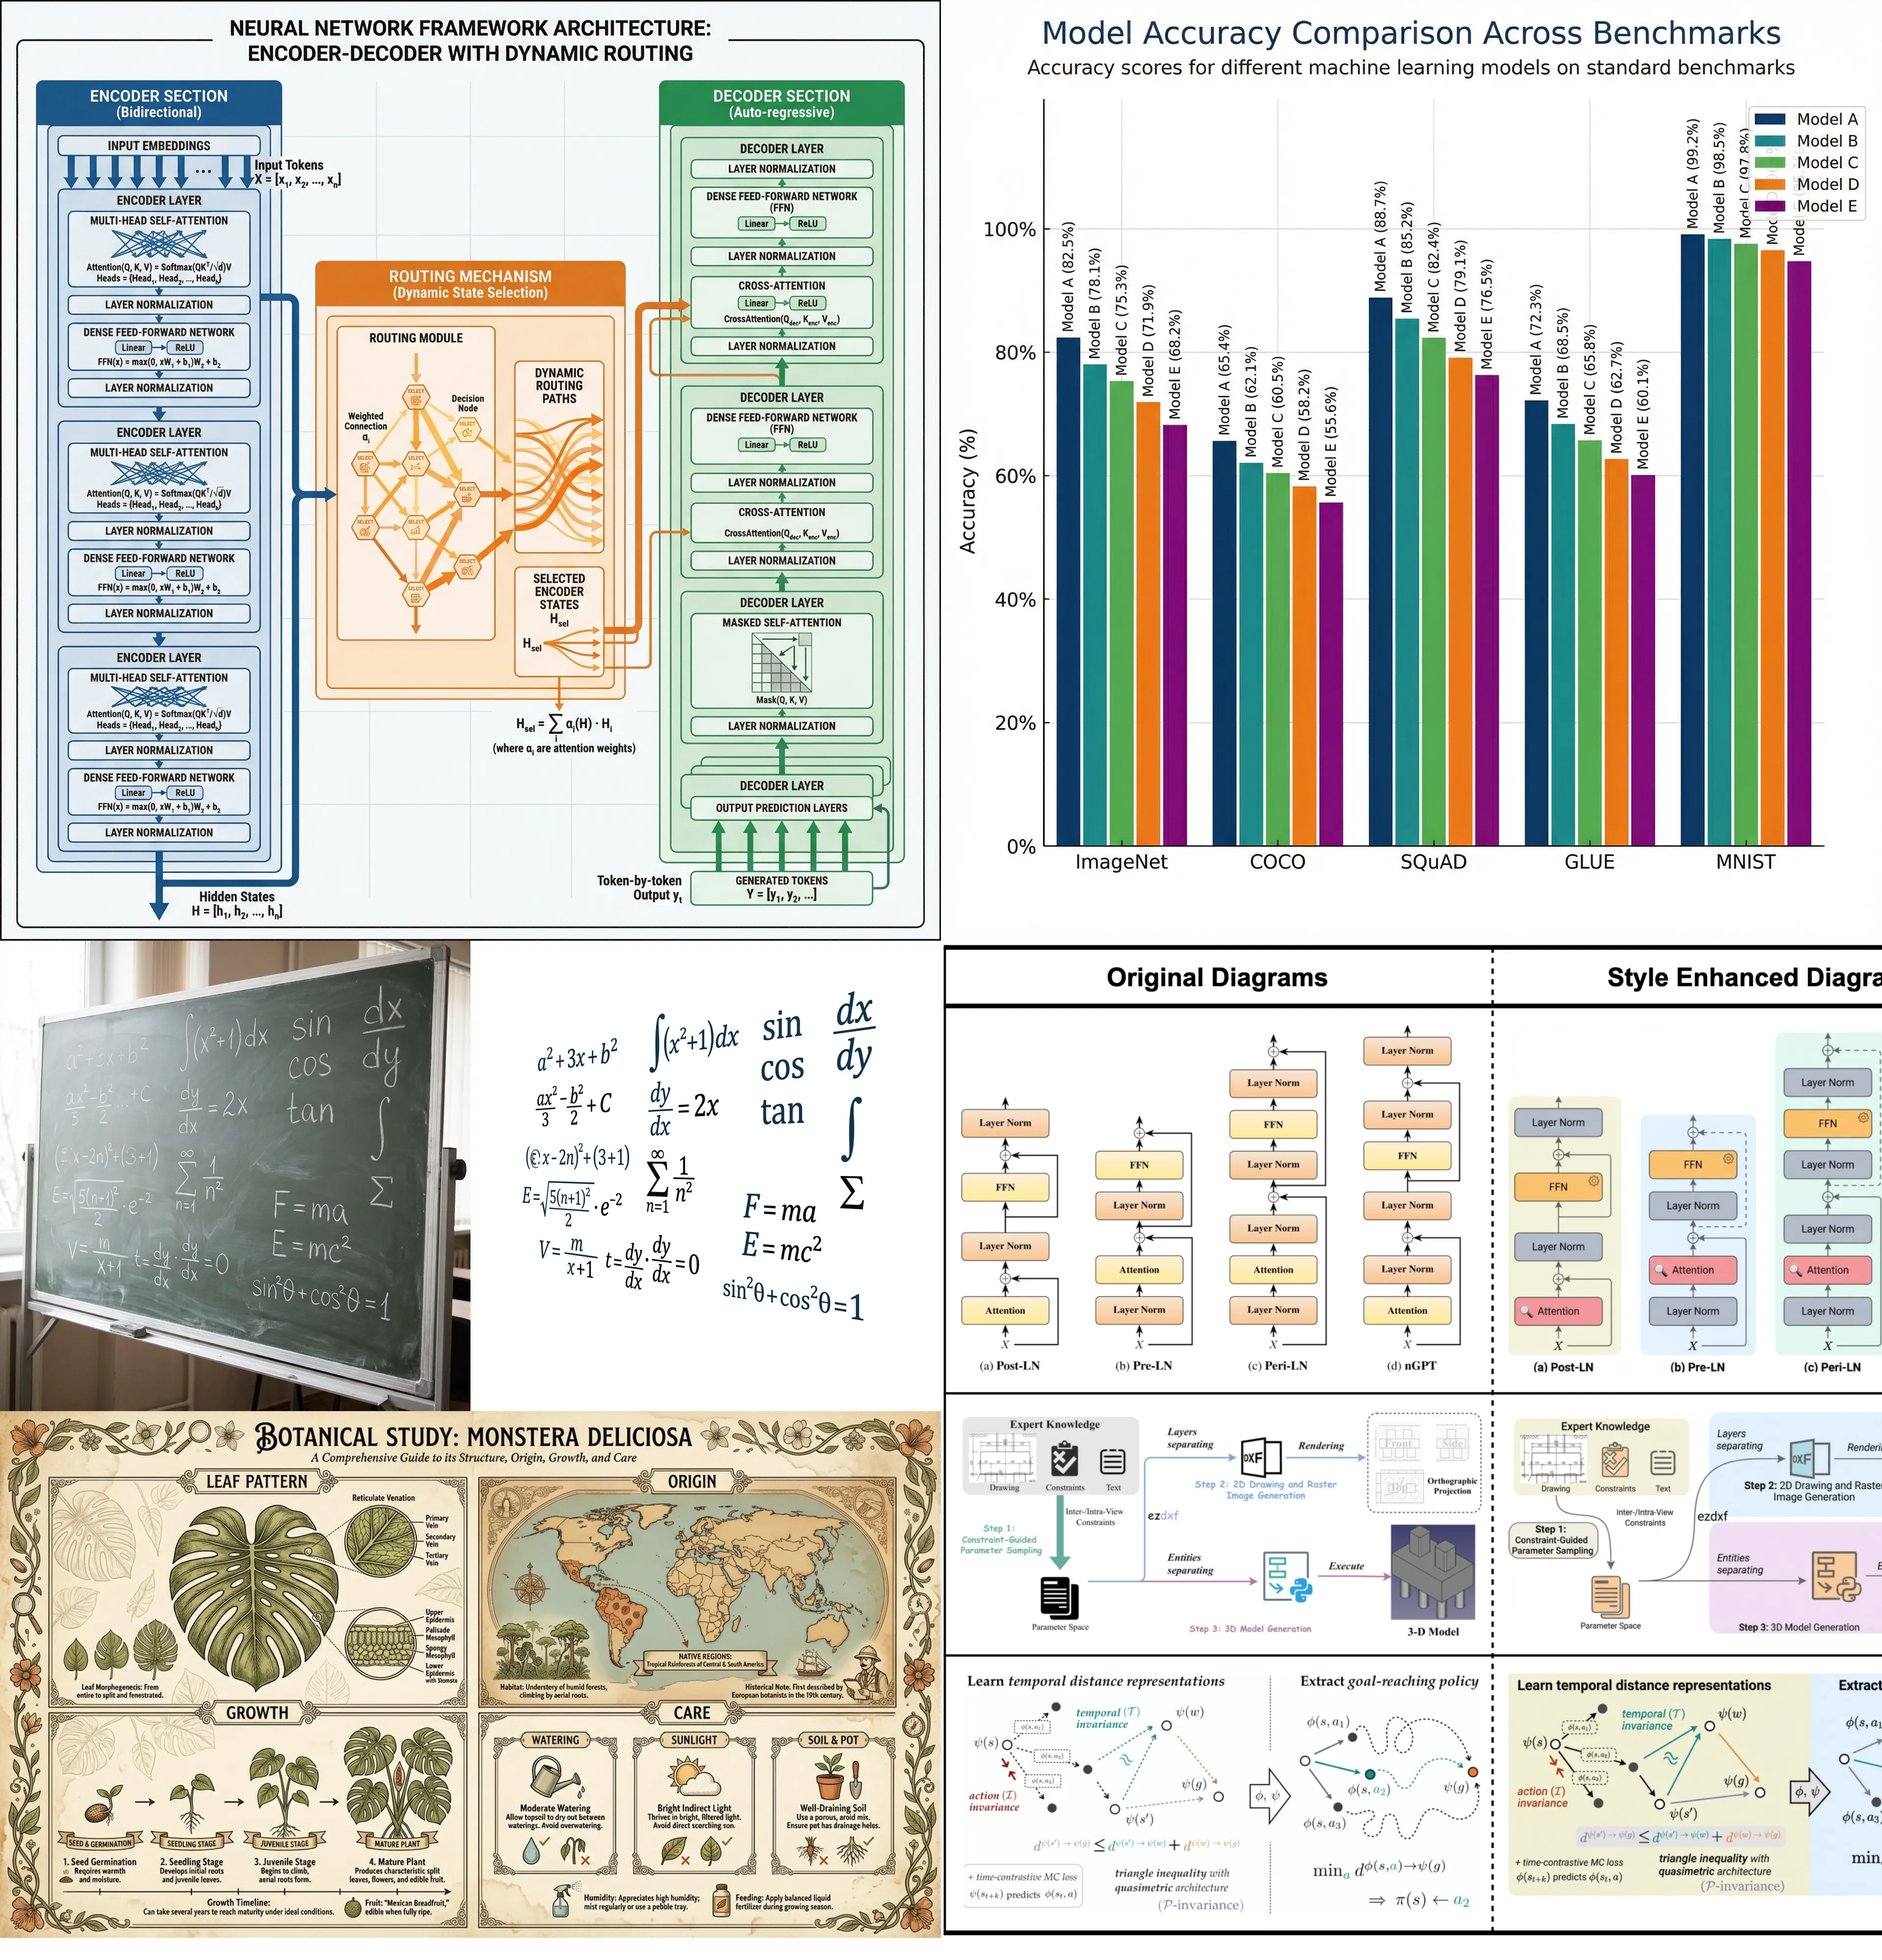
Whether you’re illustrating a transformer architecture, a GAN training pipeline, or a multi-agent system, PaperBanana understands your technical description and produces clear, well-organized diagrams. Each component is properly labeled, connections are logically arranged, and the overall layout follows academic conventions. The output is high-resolution and ready to insert directly into your LaTeX or Word document.
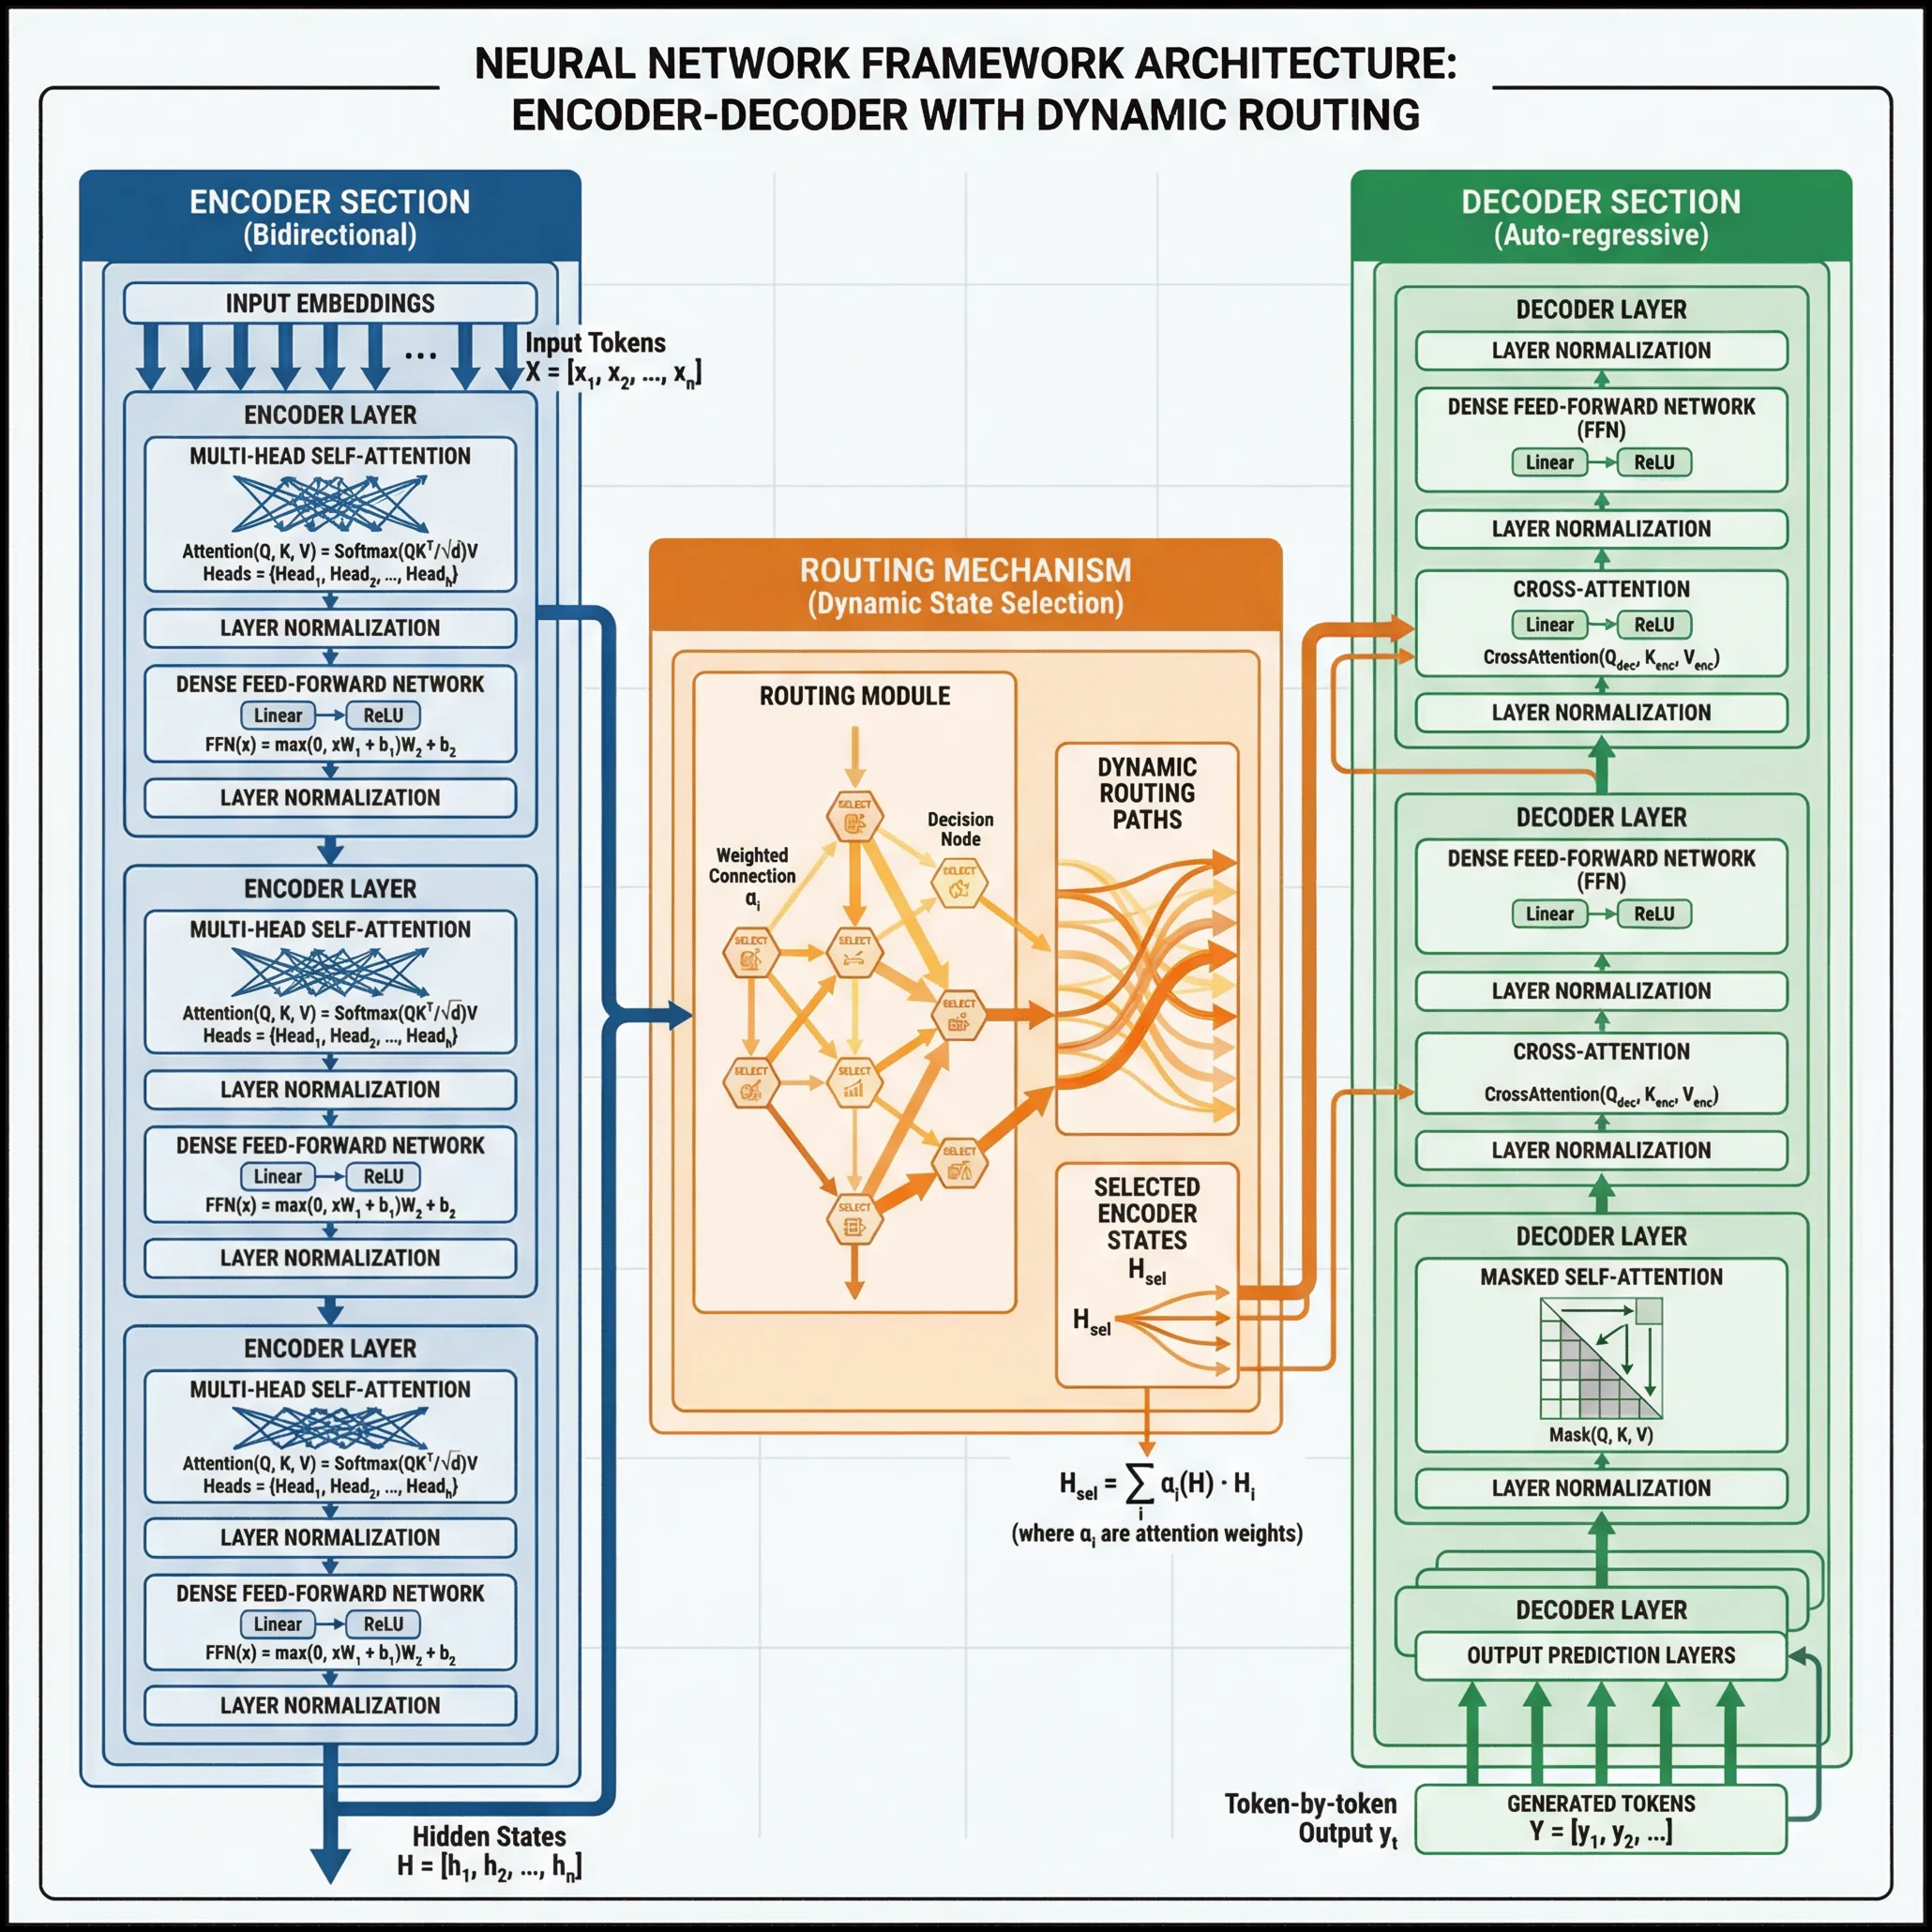
Your data deserves accurate visualization. PaperBanana generates charts where every bar height, axis tick, and data point reflects your actual numbers—not AI approximations. Provide your dataset and chart requirements, and receive publication-quality plots with correct scales, proper legends, and consistent styling. Download the figure or the underlying code for further customization.
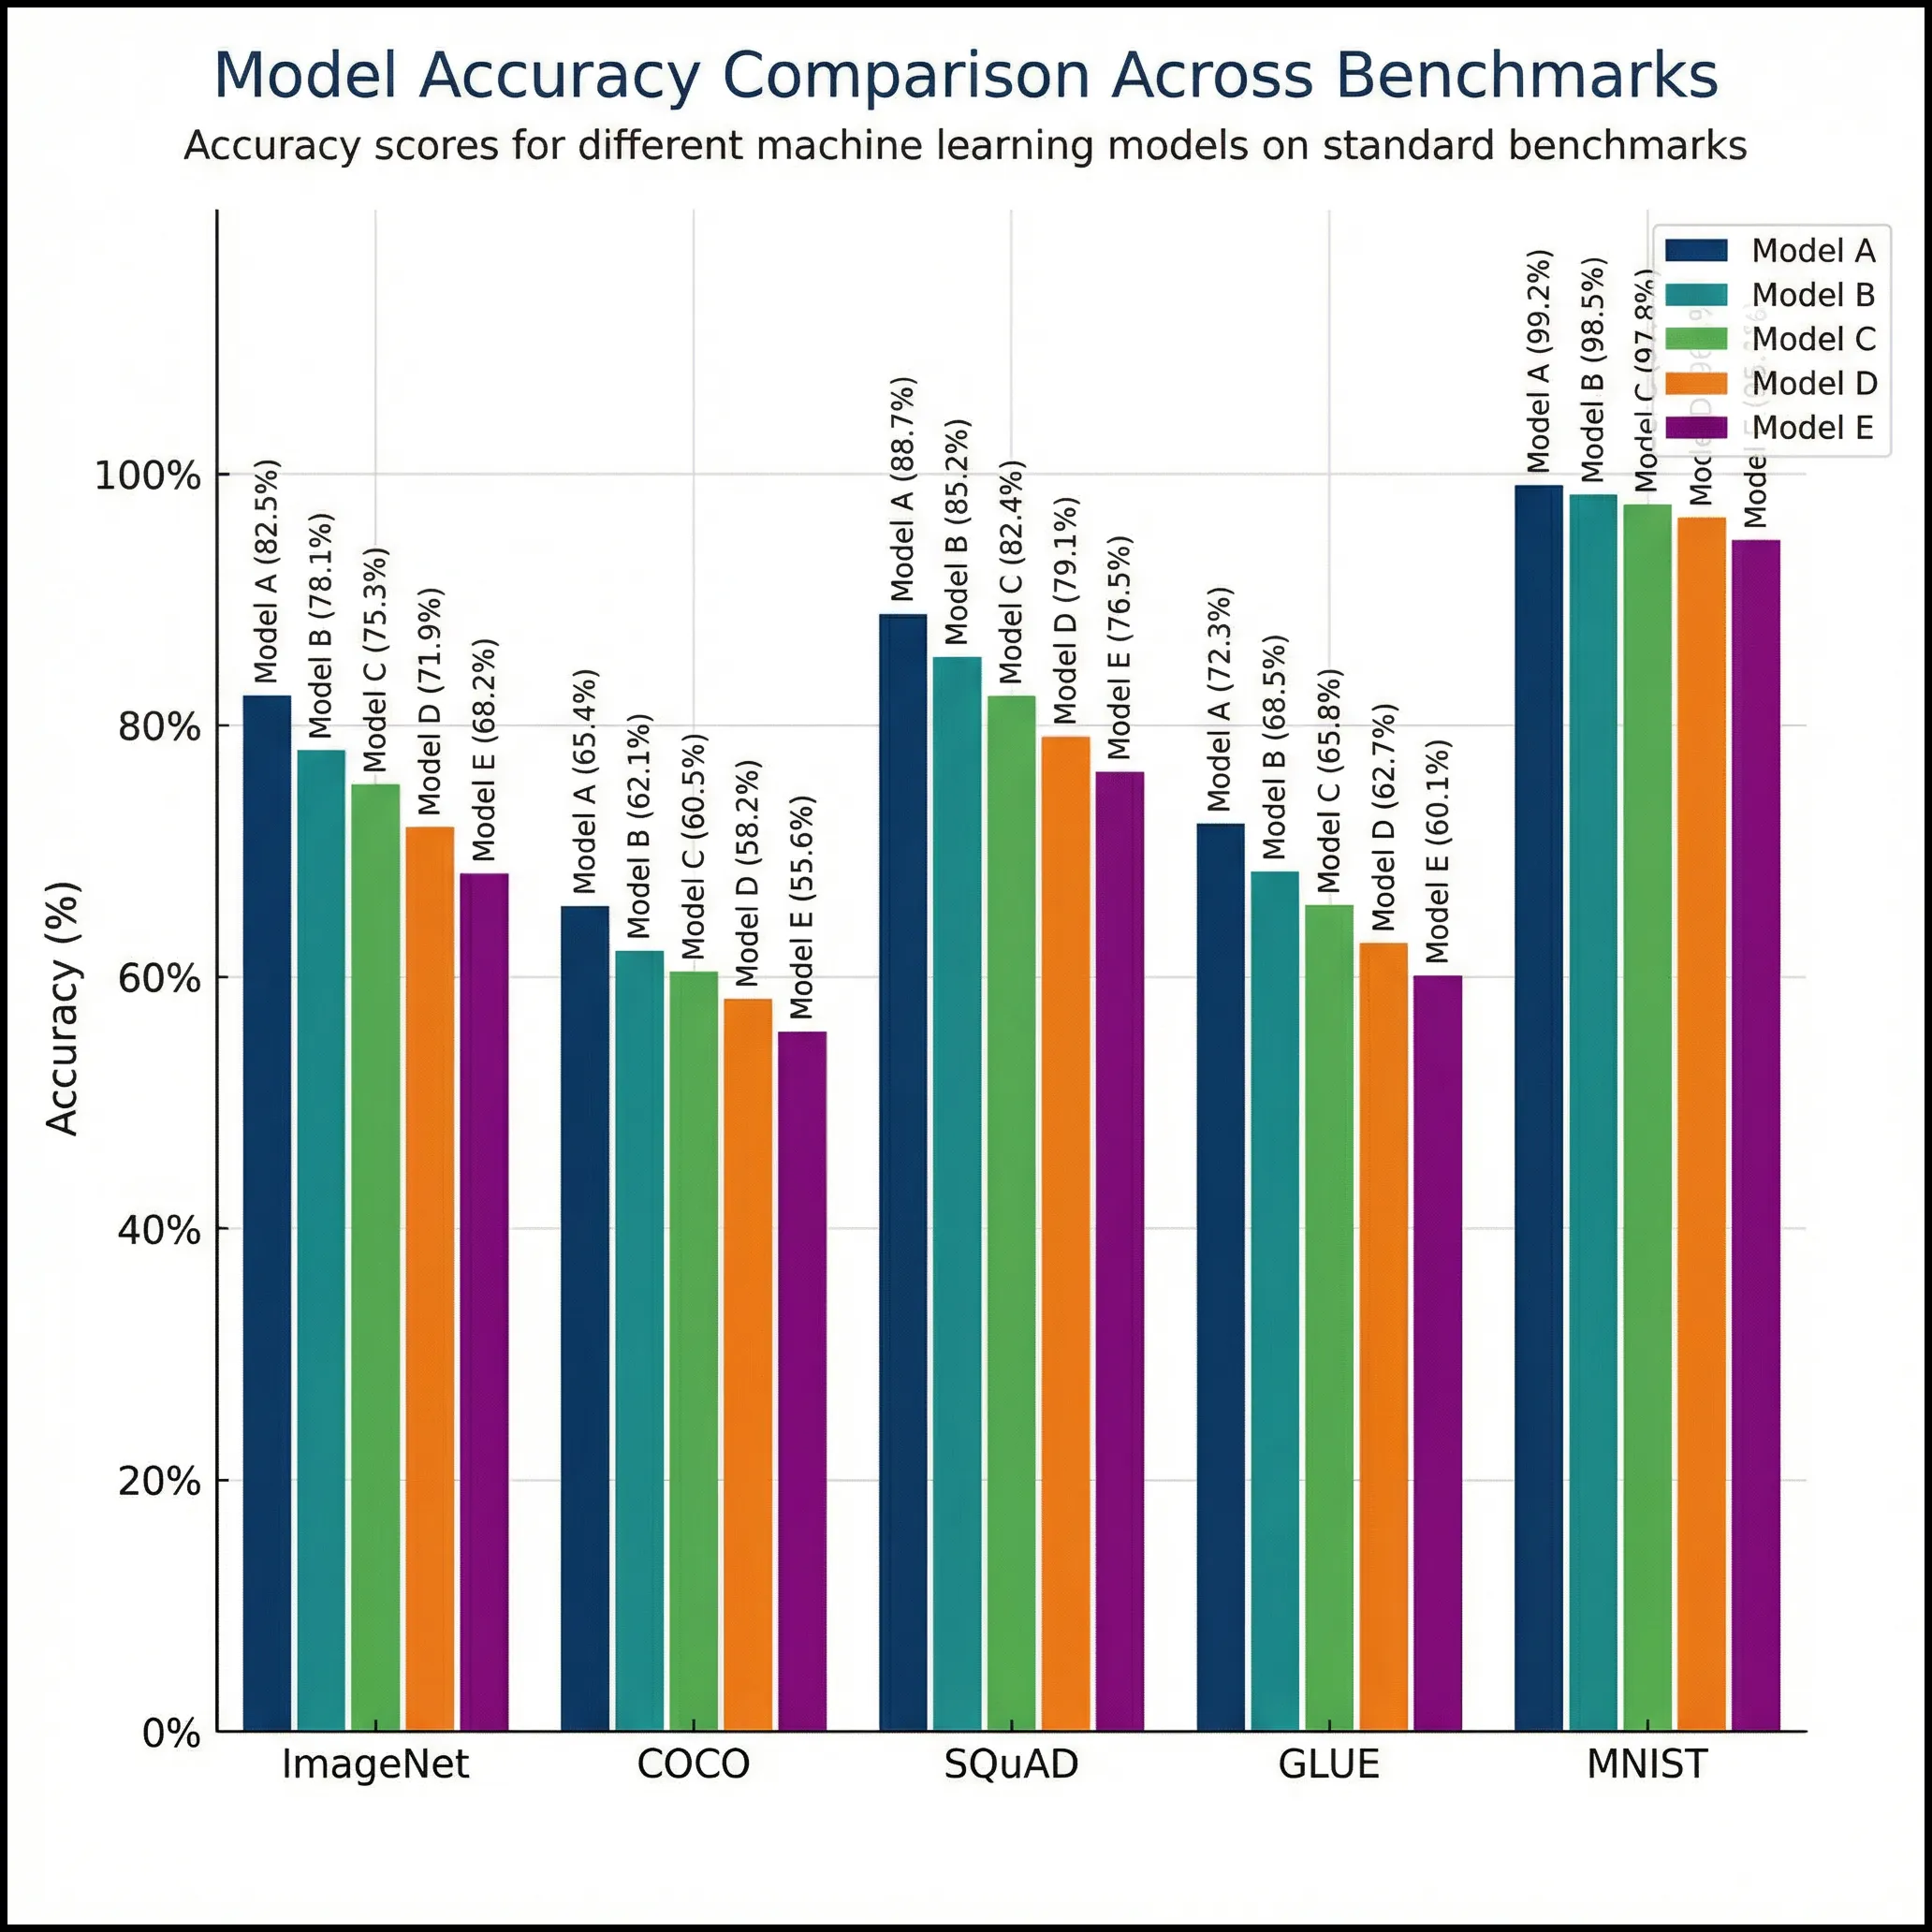
Turn your quick sketches into figures that look like they were made by a graphic designer. PaperBanana enhances your rough diagrams with clean lines, harmonious colors, and consistent typography. The structure you drew stays the same; only the visual quality improves. Ready for your next submission.
Make the complex simple. PaperBanana turns dense technical content into intuitive visual explanations—diagrams that help students grasp difficult concepts, slides that keep audiences engaged, and handouts that actually get read. Ideal for teaching, training, and science communication.
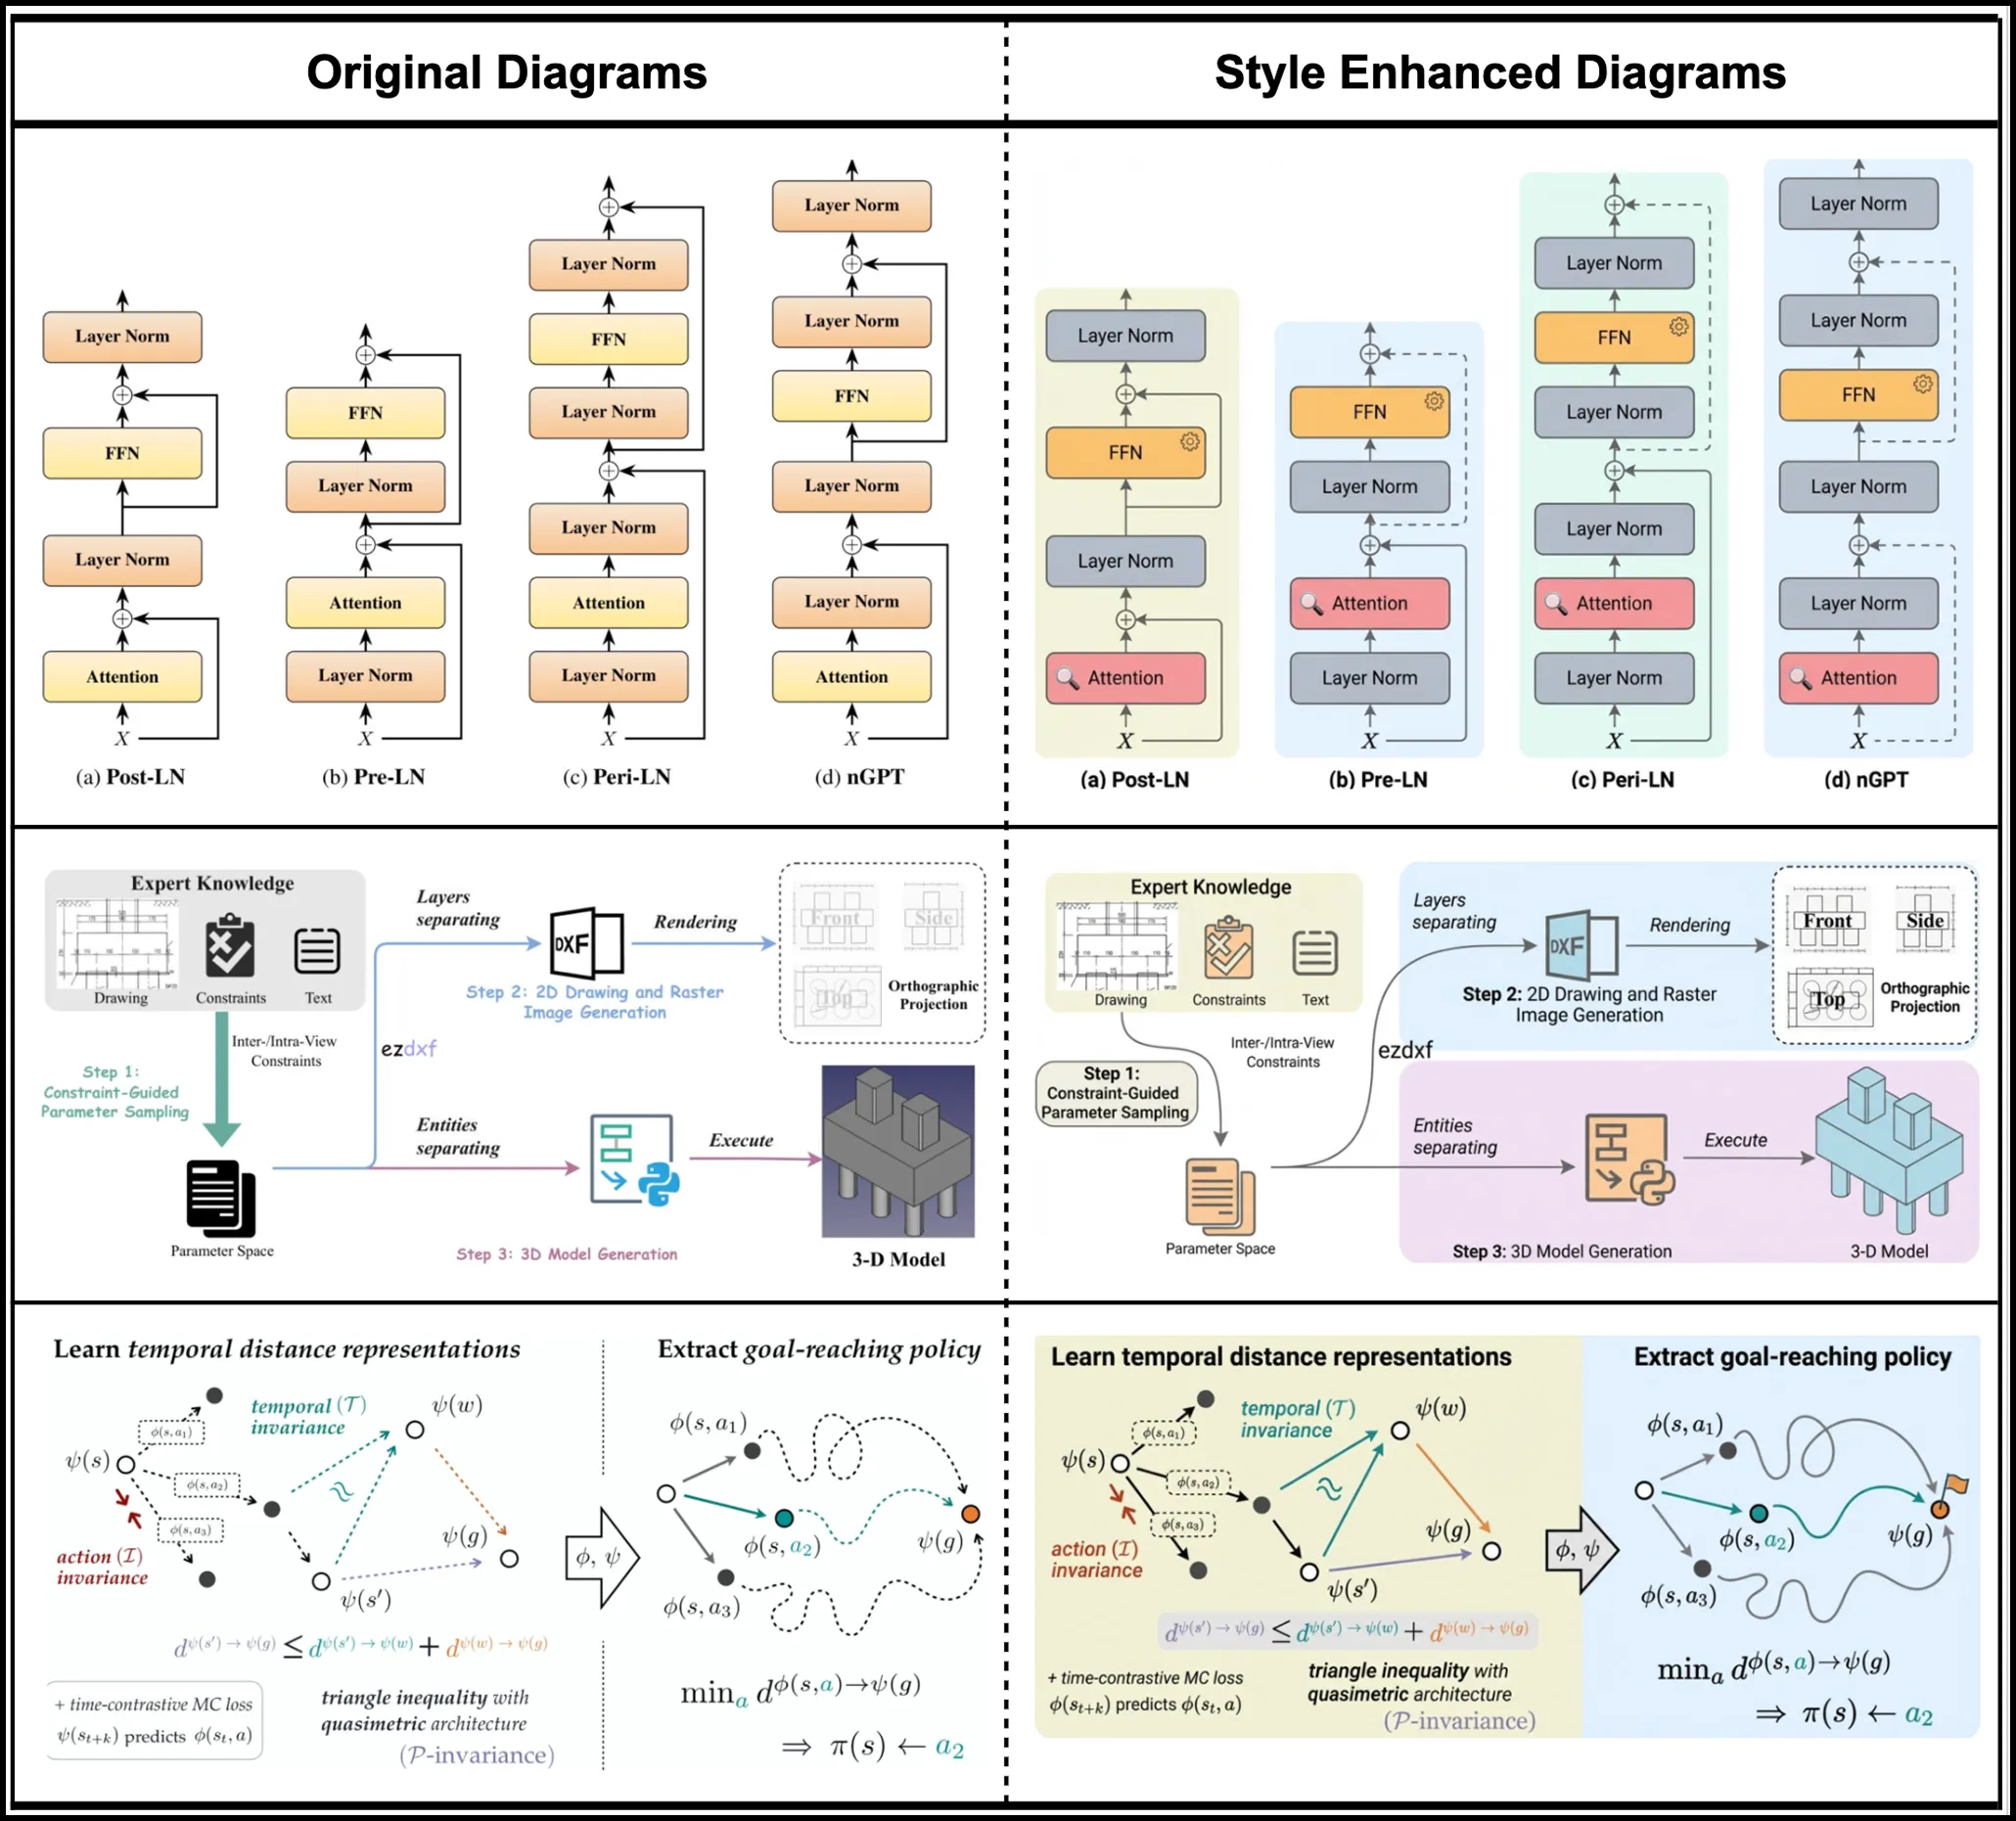
Your diagram works, but could look better. Upload it and PaperBanana will upgrade the visual presentation—better colors, cleaner fonts, improved spacing—without changing your content. Think of it as a professional design pass on your existing work. Same information, elevated appearance.
Everything you need to generate publication-ready academic illustrations. PaperBanana combines cutting-edge AI with a specialized multi-agent workflow.
Five specialized agents—Retriever, Planner, Stylist, Visualizer, and Critic—collaborate to transform your content into polished illustrations.
PaperBanana retrieves relevant academic references to guide the visual style, ensuring your diagrams match publication standards.
The Critic agent automatically reviews generated images and provides feedback for refinement until the result meets quality standards.
Generate executable Python Matplotlib code for statistical plots, ensuring numerical accuracy and eliminating hallucination errors.
From methodology diagrams to statistical plots, aesthetic enhancement to educational infographics—PaperBanana handles it all.
Download high-quality illustrations optimized for research papers, presentations, and academic posters. Ready to use directly in your publications.
PaperBanana FAQ
Learn how PaperBanana works, what types of illustrations it can generate, and how to get the best results for your academic publications.
PaperBanana supports five main illustration types: Methodology Diagrams (neural network architectures, algorithm flowcharts, system pipelines), Statistical Plots (bar charts, line graphs, scatter plots with accurate data), Aesthetic Enhancement (polishing rough sketches into publication-quality graphics), Educational Infographics (visual explanations for lectures and tutorials), and Aesthetic Refinement (improving existing diagrams’ visual quality).
PaperBanana uses a multi-agent workflow with five specialized agents. The Retriever finds relevant reference examples, the Planner translates your content into detailed descriptions, the Stylist ensures adherence to academic aesthetic standards, the Visualizer renders the images, and the Critic inspects and provides feedback for iterative refinement.
PaperBanana works with text descriptions of your research content. You can provide methodology descriptions, data for statistical plots, or descriptions of concepts you want to visualize. The more detailed your input, the better the results. You can also upload reference images for style guidance.
Yes. If the first result isn’t perfect, you can adjust your prompt and regenerate. You can also use PaperBanana’s Aesthetic Refinement feature to polish specific visual elements like colors, fonts, or layout while keeping your original structure.
Yes, all illustrations generated by PaperBanana are yours to use in research papers, presentations, posters, and other academic materials. The output is optimized to meet the aesthetic standards of top-tier venues like NeurIPS, ICML, and ICLR.
PaperBanana outputs high-resolution images suitable for publication. For statistical plots, you can also download the generated Python code to further customize the visualization in your preferred environment.
Stop spending hours on manual diagram design. Let PaperBanana’s multi-agent AI generate publication-ready academic illustrations from your research content.